Summary table with totals
Select three issue parameters: for rows, columns, and cells. The table will show the sum of values for the third parameter in issues that match each combination of the other two values.
For example, track your team's workload by Assignee and Component parameters: each column will show an assignee's name, each row will show a component name, and each cell will show the total time the assignee spent on issues with that component.
If you need to count the number of issues in cells, use Pivot table.
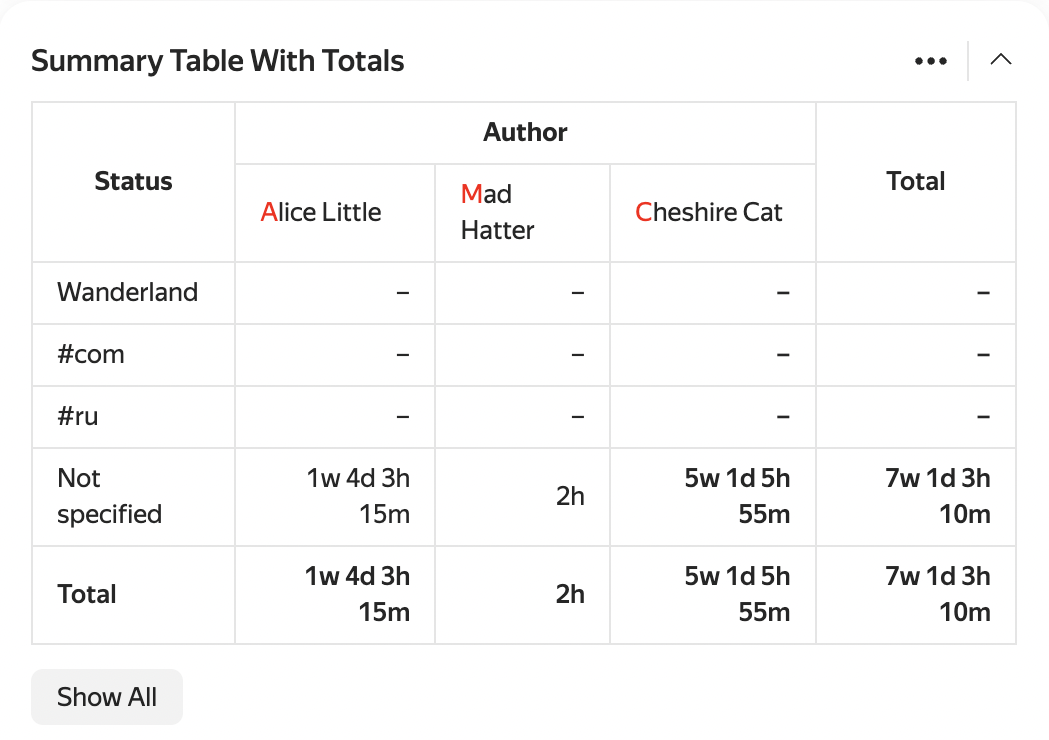
Example table
Widget settings
-
Data source — the issue search conditions for the widget. You can specify them in different formats:
- Filter — here you can select a quick filter, such as "Reported by me", or your saved filter. How to save an issue filter
- Query language — here you can enter a condition in query format. Choose this if you need to insert a function or combine several conditions with the "AND" and "OR" operators. How to set a condition using the query language
- Parameters — here you can set up a condition using buttons. How to add search conditions
-
Columns — the issue parameter whose values become the table columns.
-
Rows — the issue parameter whose values become the table rows.
-
Cells: Issue parameter whose value sum will be calculated in table cells.
The parameter must contain a number or time. -
Issues on page: How many table rows to show. If there are more rows than specified, the Show all button will appear at the bottom of the widget.
-
Sort rows and Sort columns: In ascending or descending alphabetical order.
-
Show total — enable this to add a row with the total for each column.
-
Auto-update — how often the widget will update.
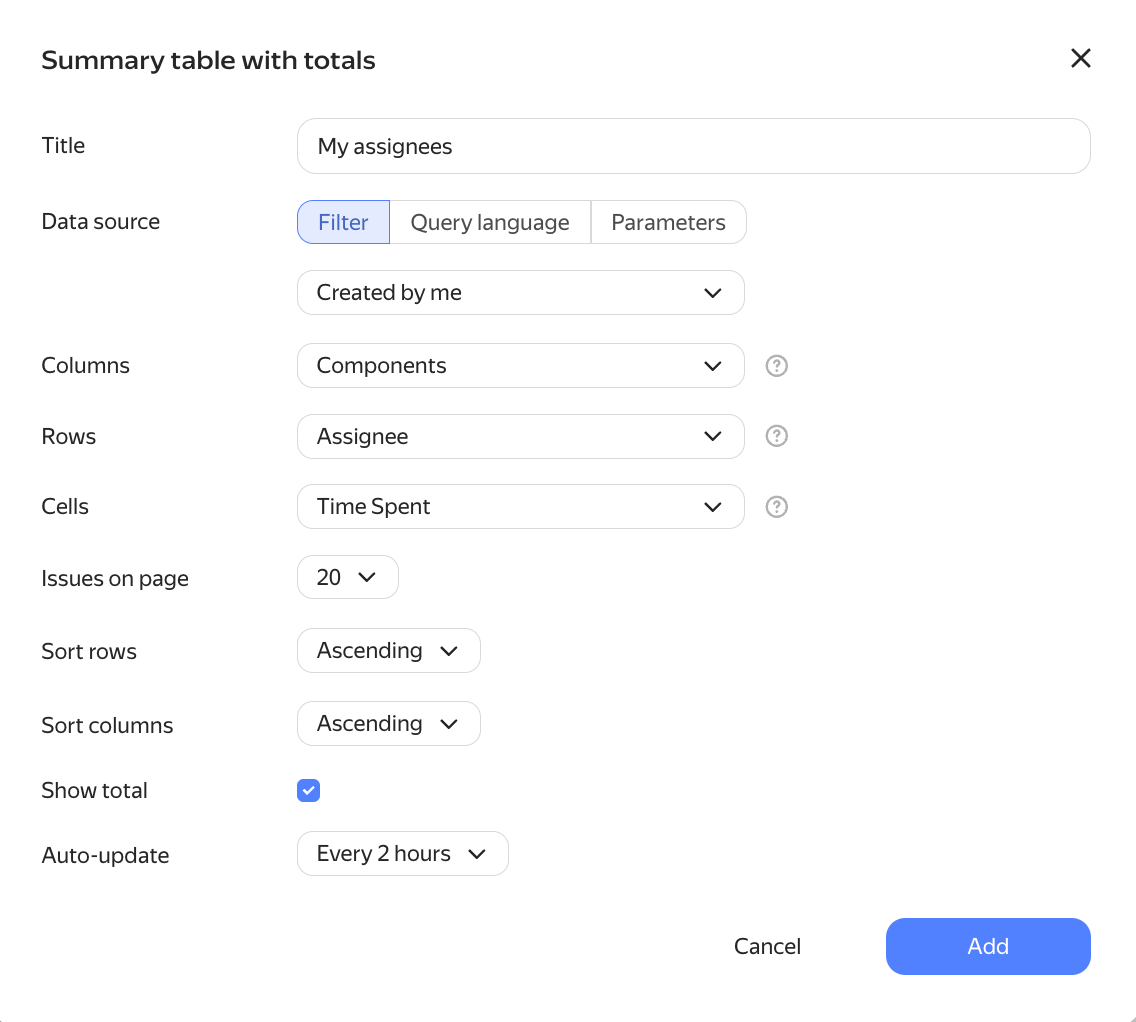
Example settings