Gantt chart for project portfolios
A Gantt chart in Tracker is a tool for creating a work schedule. The Gantt chart for a project portfolio displays nested portfolios, projects, and issues nested in projects.
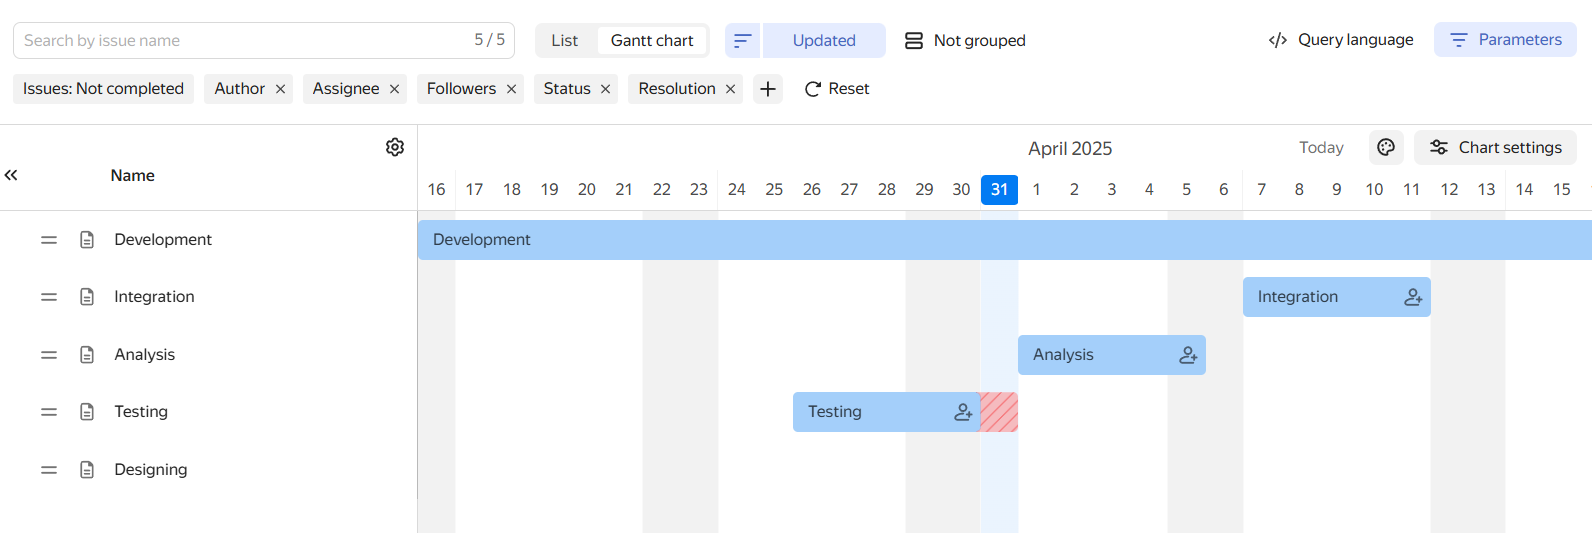
Project and issue timelines are shown on the chart as bars along the time axis. The start of each bar corresponds to the issue start date, and its end corresponds to the deadline. If an issue isn't closed by its deadline, the bar turns red.
To open the chart, open the portfolio page and select the Gantt chart tab.
How to read the chart
-
To the left of the chart, there is a list of portfolios and projects nested in the portfolio. To view the hierarchical list of issues nested in a project, click next to its name.
-
If the timeline for a portfolio, project, or issue is not specified, it is not displayed on the chart. To set deadlines, hover over the chart next to the relevant row and place the bar on the timeline. Changing timeframes
-
Arrows between issues indicate links of the "Depends on — Blocks" type. Updating links between issues
-
To change the time scale, select Week, Month, or Quarter in the bottom right corner of the chart. The scale settings persist after refreshing the page or opening the chart again.
How to assess employee workload
When planning issues on the Gantt chart, you can check an employee's workload: if a cell is red, all working time is already taken; if it is yellow, there is little free time left. For more information, see the article Check employee workload on the Gantt chart.
Moving a portfolio or project
To swap objects in the list or move a nested project from one portfolio to another, hover over the object and drag it by the icon.
Changing timeframes
-
If the timeline for a nested portfolio, project, or issue is not displayed, you can set it right on the Gantt chart: move the pointer in the chart area opposite the issue name to select an approximate date, and click the chart to pin the bar with the issue.
-
To shift the project start and end dates by the same value, drag the bar along the time axis.
-
To change the project duration, drag the left edge of the bar (the start date) or the right edge of the bar (end date).
-
If the timeline is not specified for a parent issue, project, or portfolio, its bar on the chart will be stretched from the earliest start date to the latest deadline among the nested objects.
Updating links between issues
The Gantt chart shows Depends on – Blocks issue links, provided that the Start date and Deadline fields are filled in for both issues and the Show blocking links option is enabled for the chart. Links appear as an arrow pointing from the dependent issue to the blocking issue.
You can edit issue links on the Gantt chart.
-
To add a Depends on – Blocks link, hover over the issue bar until dots appear to the right and left of the bar.
-
To make the selected issue dependent, click the dot on the left and drag it to the blocking issue.
-
To make the selected issue blocking, click the dot on the right and drag it to the dependent issue.
If the dependent issue deadline is earlier than that of the blocking issue, the arrow is red. You can enable automatic update of start dates and deadlines for dependent issues.
-
-
To delete a link between issues, click the link arrow and then click Delete link.
External blockers
If an issue has blocking links that are not part of the current project (external blockers), an icon with their count will appear to the left of the issue bar on the chart.
-
To enable displaying external blockers in the issue list, go to Chart settings → Show external blockers.
In the issue list, external blockers are highlighted in gray and displayed under the dependent issue. If the hierarchical view is enabled (the button on the filter panel), blockers are displayed under the issue branch. External blockers cannot be moved in the list, but you can open and edit them.
-
You can change the start dates and deadlines for external blockers in the same way as for other issues on the chart. Changing timeframes.
-
To delete links between external blockers and their dependent issues, click , and then Delete link.

Assigning an employee in charge
On a Gantt chart for portfolios, you can assign or change an employee in charge of a portfolio or project:
-
Click on the portfolio or project bar.
-
Enter the name of the employee in charge of a portfolio or project.
If you don't see the button on the portfolio or project bar, go to Chart settings and select assignee in the Issue bar section.
How to filter nested projects and portfolios
If you need to keep only objects that match your criteria in the list, or sort or group the list, use the buttons on the top panel.
Filters are divided into three groups: By portfolios, By projects, and By issues — you can set filtering parameters for each entity type in the list.
To add a condition:
-
Click Add a field for filtering.
-
Select a parameter, set its value, and click Apply.
If a nested portfolio is hidden after applying a filter, all objects nested in it will also be hidden.
Sort the list
To set a list sorting parameter (for example, by deadline in descending order), use the button at the top of the page:
- On the search parameters panel, click the Sorting button and select a parameter.
- To change the sorting direction (descending or ascending), click the icon that appears after you select a parameter.
How to nest a new project or issue
To add another portfolio or project to a nested portfolio, hover over it in the list to the left of the chart and click :
- To create a new object, stay on the New tab. Select the type: — portfolio or — project, and specify the name and deadline.
- To add an existing project, select the Existing tab. Start typing the project or portfolio name and select an option from the list.
To add a sub-issue, hover over the issue that will become the parent in the list to the left of the chart and click :
-
To create a new issue, stay on the New tab. Select the queue and name.
If an issue can only be created in the queue using a form, the Select form button will appear on the screen. -
To add an existing issue, select the Existing tab. Start typing the key or issue name and select an option from the list.
You can only add an issue you have access to.

Chart settings
Displaying the issue bar
Above the timeline on the right, click Chart settings and select a setting under Issue bar:
-
To show the issue name on the issue bar, select the name item.
-
To show the assignee icon on the issue bar, select the assignee item.
-
To have the missed deadline property (the difference between the deadline and the current date) highlighted in red on the chart, select missed deadline.
Timeline area
On a chart, you can configure the shift logic for dependent and parent issues, as well as issue link display.
Above the timeline on the right, click Chart settings and select a setting in Issue bar:
-
To have issues with a Depends on — Blocks link joined with an arrow on the chart, select Show blocking links.
-
To automatically move the deadline of the dependent issue when the blocking issue's deadline changes, select the appropriate option.
-
To extend the deadline of the parent issue depending on its sub-issues' deadlines, select the appropriate setting.
Issue color
Issue color settings are saved at the portfolio chart level, meaning the selected color scheme applies to all users viewing this chart.
By default, issue bars on the chart are colored according to the issue status types set in the workflow editor.
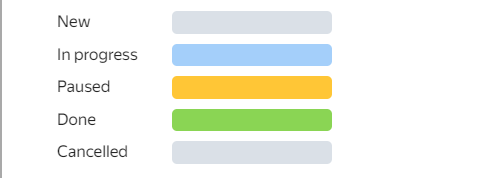
To select a different color scheme:
-
Above the timeline on the right, click Chart settings.
-
Under Color, you can choose a color scheme:
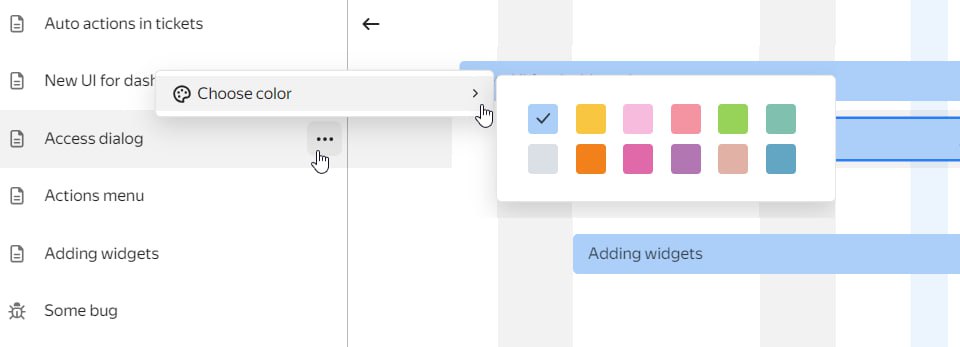
Setting a color manuallySetting colors based on issue parametersMonochromeThis option allows you to set issue colors right on the chart.
- Select manual.
- Click Apply.
Select an issue from the list to the left of the chart and click . This will open a palette where you can set the issue color.
This option will be of use if you need to differentiate issues by a certain parameter, such as a queue or tag.
- Select by issue parameters.
- Specify the parameter whose values you want to set colors for.
- Click Apply.
All issue bars on the chart will be blue.
- Select monochrome.
- Click Apply.
An issue key is a unique identifier contained in the issue link. It consists of the queue key and a number, for example TEST-123.